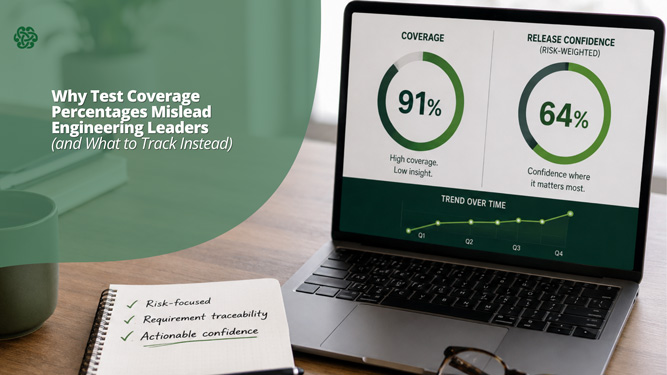
A clean test coverage percentage on a leadership dashboard can still hide the defect that ships next quarter, because coverage percentage measures testing activity, not release confidence. Engineering leaders get a more honest signal by tracking coverage against business risk and requirements, not lines of code. The Dashboard Said 91%. The Release Still Broke.
Most engineering leaders have approved a release backed by a strong coverage number, then spent the following week in an incident review explaining how a well-tested codebase still shipped a customer-facing defect. The dashboard wasn’t wrong. It was just answering a narrower question than the one leadership needed answered.
This is a governance problem as much as a testing problem. Here’s a framework for reporting test coverage the way a CTO or VP of Engineering should: one level above the raw percentage.
What “Test Coverage Strategy” Means at the Leadership Level
Test coverage strategy is the set of decisions an engineering organization makes about what gets tested, how deeply, and how that testing effort is reported upward, so a coverage number reflects business risk rather than just code that executed during a test run.
At the engineering team level, coverage is usually a code metric: which lines, branches, or functions ran during testing. At the leadership level, that number is close to meaningless on its own. What a CTO or Head of Quality needs is a release-confidence signal are the parts of the product most likely to cause customer or compliance impact adequately tested, and can that be demonstrated after the fact.
This is the distinction our QA Maturity Model is built around: coverage is one input into maturity, not the maturity score itself.
Why Coverage Percentage Is the Wrong KPI for a Leadership Dashboard
Three reasons a raw coverage percentage doesn’t belong on a leadership dashboard by itself:
1. It rewards volume, not judgment. Teams under deadline pressure can lift a coverage number by testing low-risk code paths, without improving confidence in the release.
2. It has no relationship to defect history. A function that has caused three production incidents and a function that has caused none get equal credit for the same coverage percentage.
3. It doesn’t survive an audit conversation. When a customer, regulator, or board member asks, “how do you know this was tested,” a percentage isn’t evidence. A traceability record is.
A Maturity-Based Framework for Reporting Coverage Upward
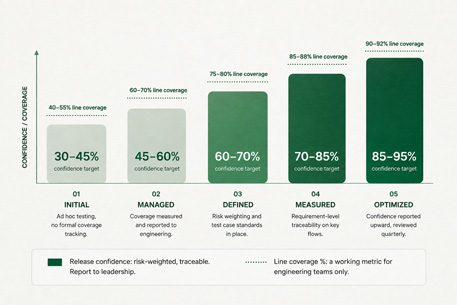
1. Separate activity metrics from confidence metrics. Report coverage percentage to engineering teams as a working metric. Report release confidence, coverage weighted by defect history and business risk, as the number that goes to leadership.
2. Anchor coverage targets to your QA Maturity Model stage. Teams earlier in their maturity journey should expect lower confidence scores even at high coverage percentages, because traceability and risk weighting take time to build. That’s expected, not a red flag, if the trend line is moving the right direction.
3. Require traceability on anything customer-facing or regulated. Coverage on payment flows, authentication, and anything touching SOX, NIST, or ISO controls should be reported at the requirement level, not the code level.
4. Review the framework quarterly, not just at release time. A QA Roadmap reviewed quarterly catches coverage decay before it becomes an incident review topic.
A team we’d rate mid-way through the QA Maturity Model typically reports two numbers side by side: an 85%-line coverage figure for engineering, and a release-confidence score in the 60s for the highest-risk 20% of the product. That gap is not a failure. It’s the honest starting point for next quarter’s QA Roadmap.
How This Shows Up in Platform and Vendor Evaluations
This same shift, from coverage percentage to traceable, risk-weighted coverage, is exactly what QA teams should be pushing their tooling to support. Our sister publication on the QAConnector blog goes deeper on the practitioner side of this: What Test Coverage Really Means (and How to Measure It) walks through how to build a risk-based coverage framework day to day, and what auditors and CIOs actually check for.
If your organization is evaluating whether your current QA tooling supports requirement-level traceability, that’s the right question to bring into the evaluation, not “what’s our coverage percentage.”
FAQ
Is test coverage percentage a good KPI for engineering leadership?
Not on its own. It measures testing activity, not release confidence. Leadership dashboards are better served by a risk-weighted, traceable version of coverage.
What is the QA Maturity Model?
CelticQA’s framework for assessing an organization’s current QA state, including how coverage is measured and reported, and structuring a QA Roadmap to close the gaps.
How often should engineering leaders review test coverage?
Quarterly at minimum, alongside the QA Roadmap, rather than only reviewing coverage numbers in the days before a release.
What should replace coverage percentage on a leadership dashboard?
A release-confidence score that weights coverage by business risk and defect history, plus a traceability record for anything customer-facing or regulated.
Does higher test coverage always mean lower release risk?
No. Coverage that isn’t weighted by risk or tied to specific requirements can be high while the area’s most likely to cause a defect to remain under-tested.
Conclusion
The coverage percentage tells you how much testing happened. It doesn’t tell you whether the right things were tested, and it won’t hold up when a customer, regulator, or board member asks for evidence. Build the muscle to report confidence, not just coverage.
Schedule a QA Maturity Assessment with CelticQA to see where your current coverage reporting stands.
